


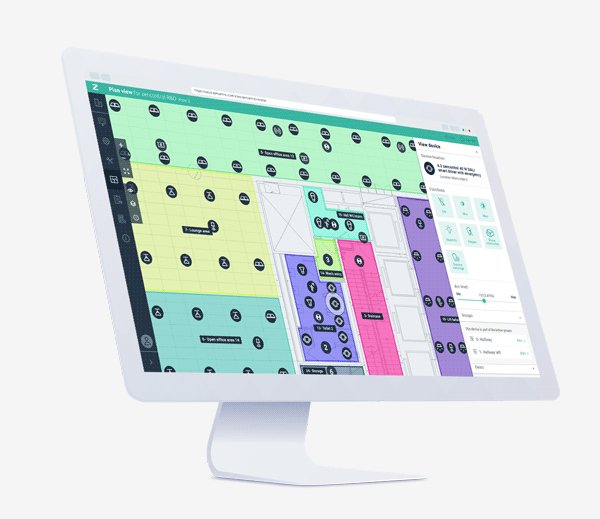
Free Plan view
Plan view is free and comes with your standard Cloud subscription, simply login to your Cloud account and head to your Plan view page to use it today.
With the free Plan view you can:
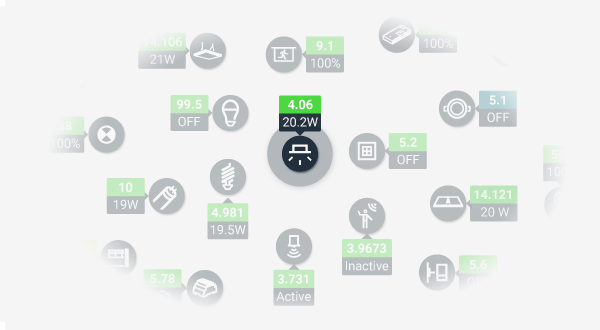
- View your building through a familiar interface: floorplans
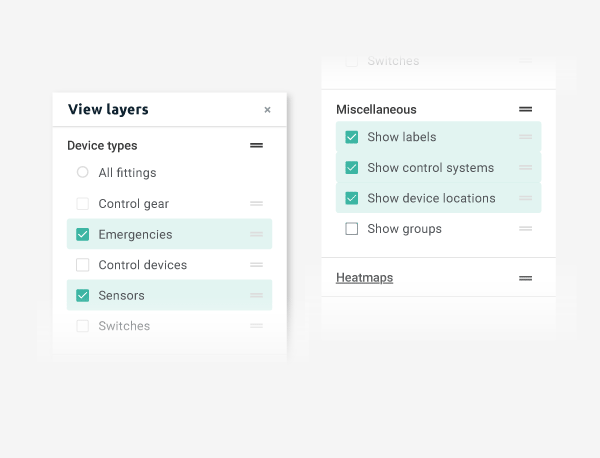
- View devices; their location in the building, IDs, groups and status
- Control device functions: arc level, max, min and more
Not signed up to the Cloud? Get started today by visiting cloud.zencontrol.com.
Upgrades can be added at any time, without the need for additional any commissioning or hardware.
Additional add-on’s can be purchased and increases the functionally provided in Plan view. Some available add-ons are:
- Power
- Heatmaps
- Faults and issues
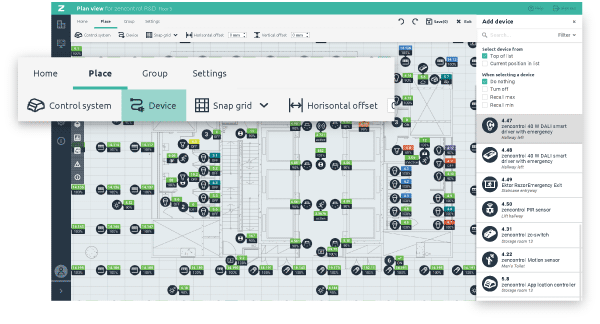
Fast commissioning
Quickly place devices onto the plan with drag and drop, or single click placement options.
Enjoy features like:
- Device type search
- Alignment tools
- Selection tools
- Snap to grid
- Draw regions to define rooms/groups
- Replace plans as they change
- Fine tune map placement
- Single click to place
Define your fitting types including manufacturers, description or codes to each fitting for easier maintenance and reporting. Assign unique icons to each fitting type to allow easy recognition when viewing the plan.
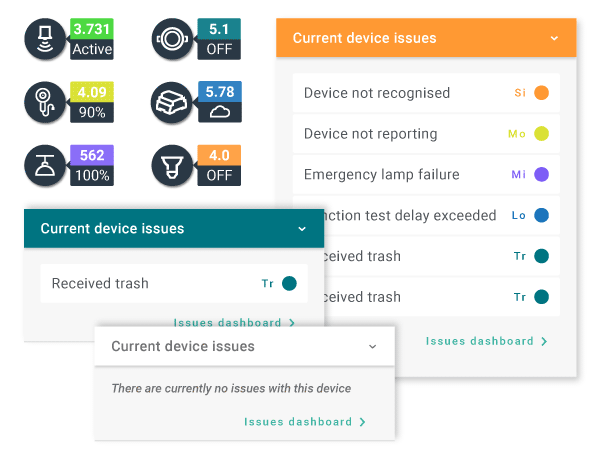
Faults and issues
Understand the current state of your building devices with a glance at its floorplans. Issues are colour coded and can be highlighted so that the most critical issues can been identified on the plan and rectified quickly.
The Cloud gathers data from almost every device in the building, including sensors, switches, lighting, emergency devices and controllers. This data is collected in near real time, no matter the building size.
This enables the facilities maintenance teams to quickly and accurately track the system performance with a wide range of reported issue types.
Bring power to the plan through Plan View visualisation tools and Cloud infrastructure that can handle millions of power datapoints.
zencontrol’s DALI Application controllers brings power to the plan by collecting power consumption data from every compatible light fitting, DALI switch and DALI sensor in 15-minute blocks. It then streams the data to the Cloud for processing, storage and visualization.
This enormous dataset allows facility managers and building owners to understand and correct their building usage providing invaluable information for owners truly committed to making their building green.
Use power datapoints to reduce your sites power consumption
- Identify high power consumption areas.
- Target high consuming areas to save electricity faster.
- Employ control strategies to reduce power consumption.
- Track the performance of changes.
- Understand the buildings use per fitting, room, floor or departments.
- See the benefit of features such as task tuning or daylight harvesting.
- See lighting, which is not turned off, when it should be, and make changes.
- Works with Tridonic PRE-devices, zencontrol drivers and DALI devices supporting DALI Device Type 50 without additional commissioning.
- Supports for older DALI compliant devices through interpolation.
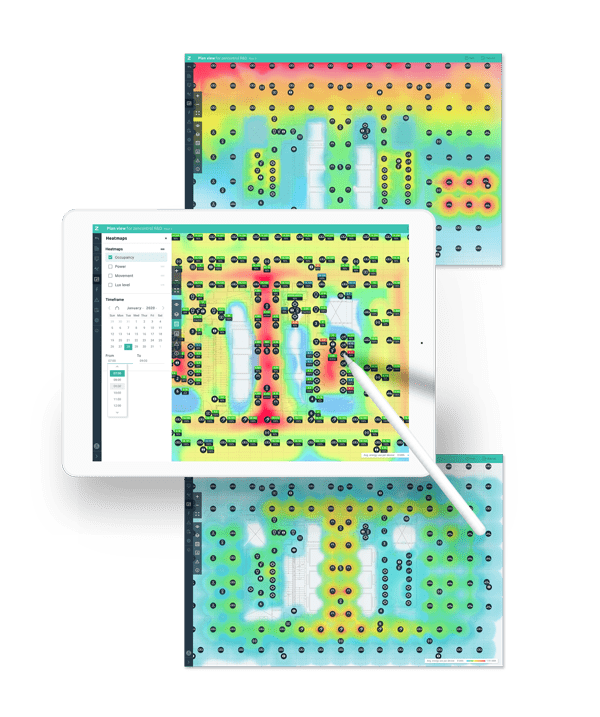
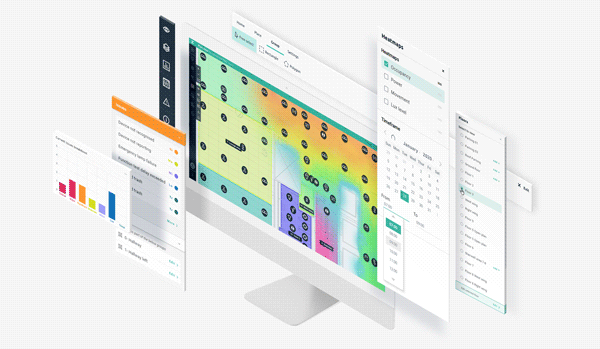
Quickly and easily identify faults, power usage and high/low occupancy with heatmaps.
Lux level
Identify areas which can be fine-tuned to provide greater savings with lux level and use-case mapping.
Occupancy
An occupancy heatmap overlay provides an easy way to understand the most utilised areas and the flow of people throughout the day.
A user can select and compare different time periods to understand periods of the day which may need to be addressed. Use occupancy heatmaps to prioritise maintenance or redesign offices for maximum ROI.
Power
Viewing a power heatmap over Plan view allows users to see where the power is being consumed and take appropriate steps in reducing the power usage.