

Smart buildings
The evolution of smart data onto a DALI-2 platform increases value to stakeholders while optimising the cost of deployment as the data is made available on a standard DALI-2 installation. DALI-2 provides stakeholders the flexibility to use devices from different manufactures that support the DALI-2 standards.
Our Analytics suite can process a wide variety of data
Wired or wireless
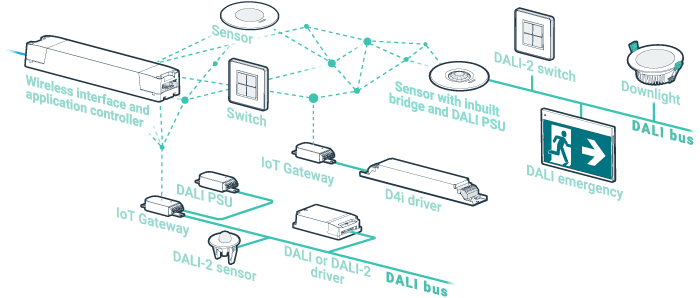
zencontrol supports wired and wireless DALI buildings, with full wireless support of IEC62386-104 devices over UDP and Thread®. Customers get to experience the same features and benefits independently of their choice of connection technology.
A zencontrol control system can detect devices supporting power monitoring standards and will stream their power consumption every 15 minutes to zencontrol’s analytic servers for processing.
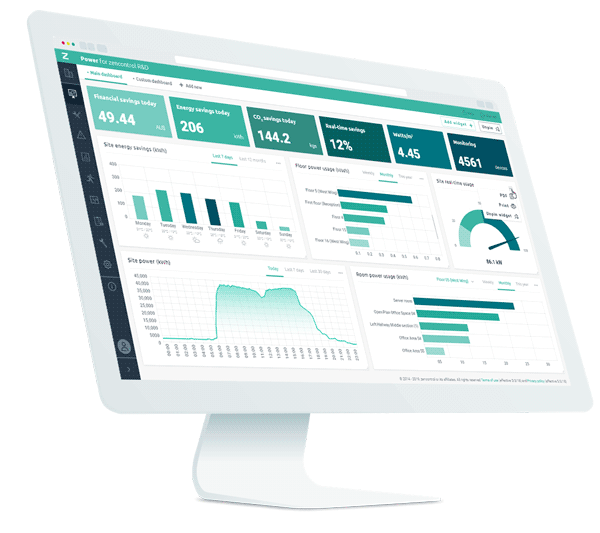
Power dashboard
When comparing the energy consumption of a building, all contributors require consideration. With zencontrol’s Power analytics, the power consumption of all compliant DALI-2 devices is tracked to provide accurate and encompassing data.
See the amount of CO2 saved by energy saving features deployed in the building
The dashboard works out watts/m2 of the building using your buildings setup
Daily energy savings from features such as task tuning, sensors placement, daylight harvesting and other.
Create your own custom dashboard with specialised widgets and graphs focused on the areas you want to see
…and more
Per-fitting power monitoring for DALI-2 devices: emergencies, light fittings, switches, sensors and more
- See per fitting, room, floor or departments
- Identify high power consumption areas
- Works with Tridonic PRE range of led drivers
- Support for older DALI compliant sites on
- Get per-fitting power measurements with the smart driver
- Employ strategies to reduce power consumption
- Change your building control to maximise energy savings
- Provides a cloud connected API to suit large scale BMS
- Track power usage over time to see how power saving plans have worked
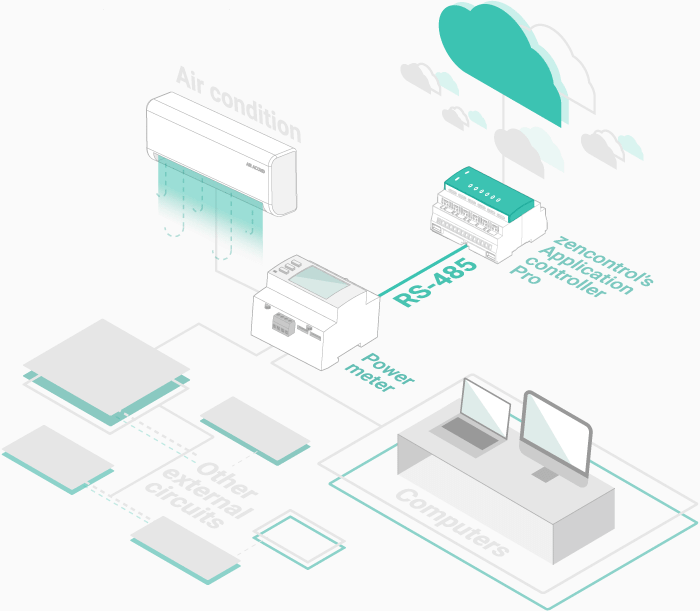
- Shows power data of external circuits through RTU power meters
The Issues dashboard allows maintenance teams to quickly and accurately track the system performance with a wide range of reported issue types.
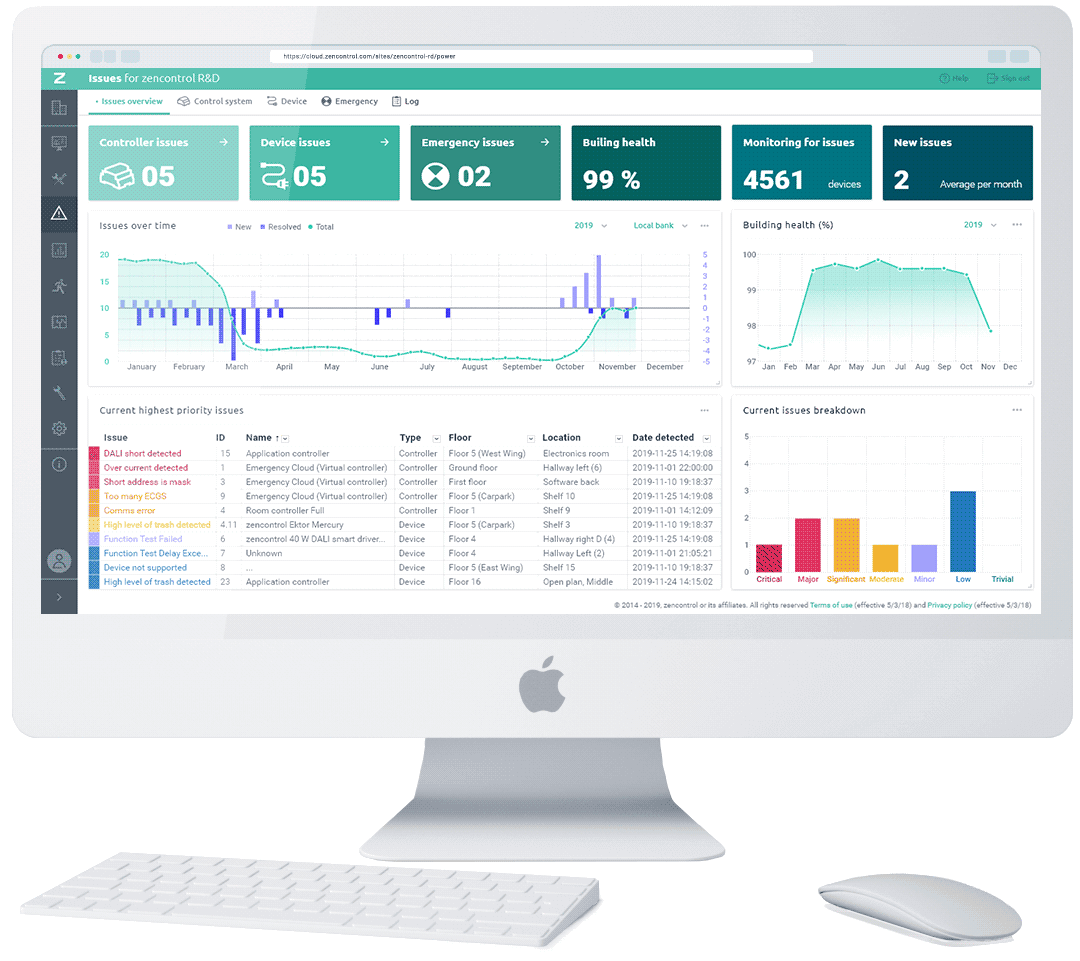
Building health
…and more
The Analytics dashboard allow you to compare and analyse your sites operation, understand the details, make changes and then validate the results.
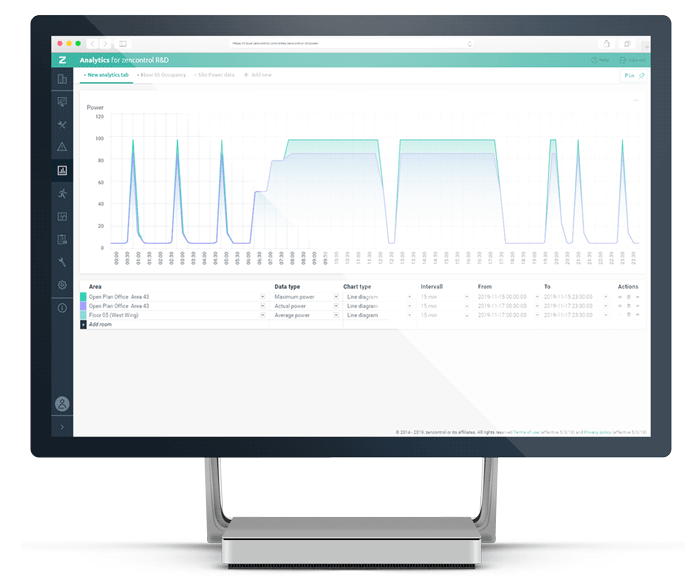
Compare your data
…and more
Previous comparisons can be saved / pinned to allow user to keep track of data for specific areas, rooms and sites.
Payback tracking
Lifetime
Understand the lifetime of a manufactures’ products with full lifetime tracking and statistics.
Lifetime tracking allows building own to see which brands are preforming better, and living up to the manufactures promise.
With the Occupancy dashboard zencontrol uses DALI-2 compliant occupancy sensors to track and understand occupancy within each area, with each sensor providing a full set of occupancy data.
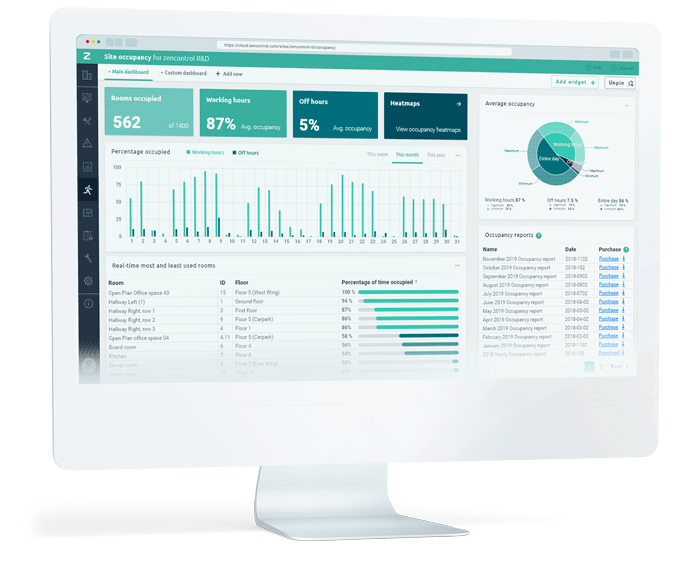
Making informed choices
Understanding how areas are used is of utmost importance to any building owner or company seeking to be effective.
Use analytics to visualise and interact with your devices on Plan view. Quickly and easily identify faults, power usage and high/low occupancy.
Plan view
With the zencontrol plan view, Facilities managers, maintenance engineers and planners can quickly and easily visualise the site
- See faults
- See the current light levels
- Make repairs easily
- Click on lights / sensor / switches to configure and set up
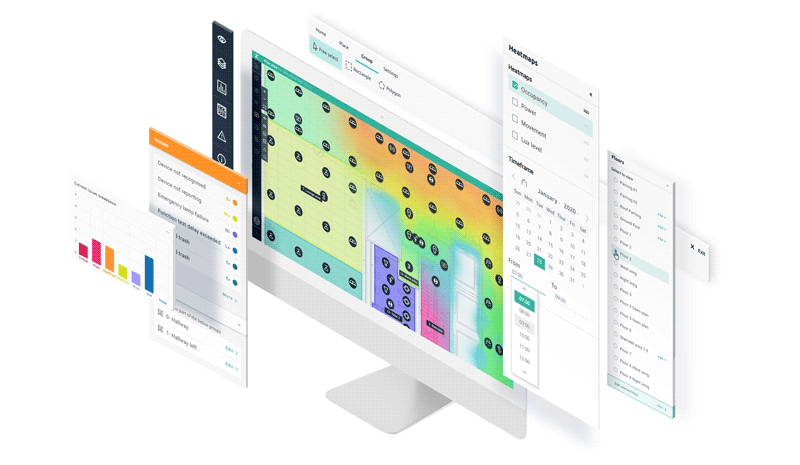
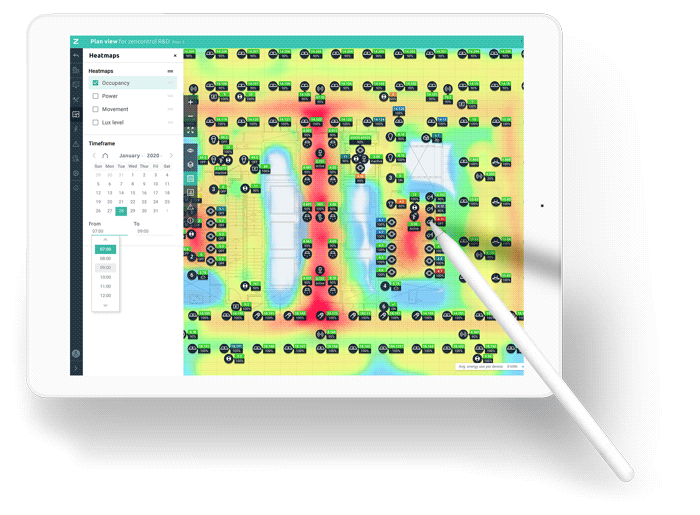
Occupancy use maps
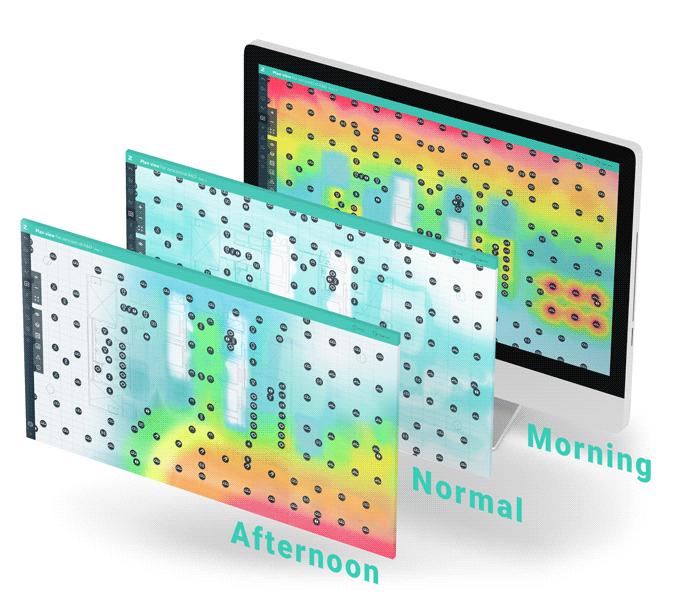
An occupancy heatmap overlay over the zencontrol Plan view provides an easy way to understand the most utilised areas and the flow of people throughout the day.
A user can select and compare different time periods to understand periods of the day which may need to be addressed.
- Schedule maintenance on usage
- Understand when resources are over booked
- Prioritise maintenance and upgrade based on risk
- Change lighting control based on usage for max. energy savings
- Determine main movement paths and critical areas for maintenance
- See which rooms/areas have the highest utilisation, reconfigure
- Use the Smart driver in your lights for per-fitting occupancy mapping
Lux level mapping
With zencontrol you can avoid traditional methods of understanding lux levels and daylight harvesting where personnel use portable lux meters to take manual readings. Identify areas which can be fine-tuned to provide greater savings with our lux level and use-case mapping.
With lux level mapping a user can:
- Understand their light levels better
- Understand how well the lighting has been setup
- Understand how much natural daylight has contributed to light levels
- Determine critical lighting areas easier
- Change your building control to maximize energy savings
- Use the Smart driver in your lighting to get per fitting lux measurements
Resources
Learn more and discover more of what the zencontrol Cloud has to offer using the below resources.