

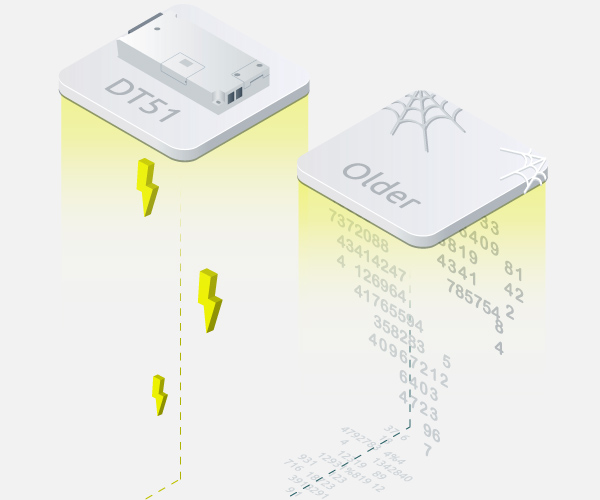
Supports automatic power measurements from DALI-2 DT51 devices, and supports older sites.
zencontrol automatically detects DT51 DALI-2 devices and will automatically read the power consumption from the devices and streams to the Cloud for processing.
For older sites that do not have these devices installed, zencontrol, can use the average arc level from each device, (calculated per second to increase accuracy) and the maximum power consumption of each device to calculate the 15-minute power consumption.


Every 15 minutes, synced to the hour, power consumption is recorded, from every connected device.
Millions of readings
Every 15 minutes, synced to the hour, zencontrol records the power consumption from every connected device. On a site with 5000 devices this equates to 480,000 power readings per day and over 175 Million individual readings per year. This data gives users the ability to truly understand the power usage in the building.
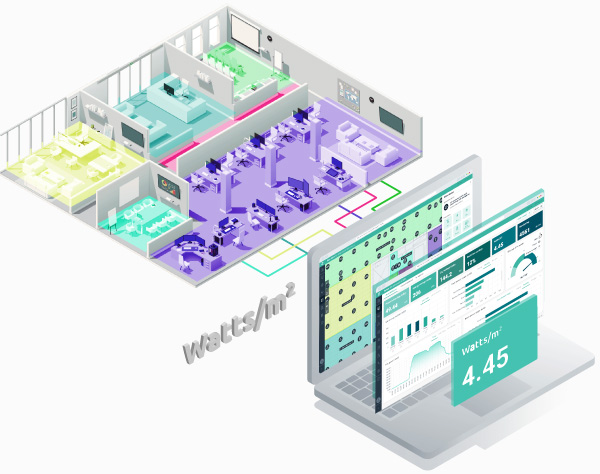
Accurate Watt/M2 calculations, for the entire building, common areas, and each tenancy
Building, tenancy and common areas can automatically show real time accurate W/M2 calculations with zencontrol Plan view. Simply setup your zones on the plan and the area and power consumption will be calculated. Use this data to compare to the original design or as a benchmark.
Additionally, as new DT-51 devices are added, the power consumption will be adjusted to ensure through life accuracy.

Benchmarking
Add multiple benchmarks for sites and tenancies to track the energy performance of the building. Easy understand how the building is performing against your goals.
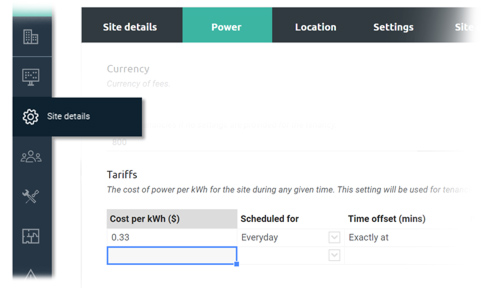
Multiple tariffs
Energy providers supply power at different rates depending on the time of day. Add your tariffs or rates to your building and track your power consumption and savings with greater accuracy.
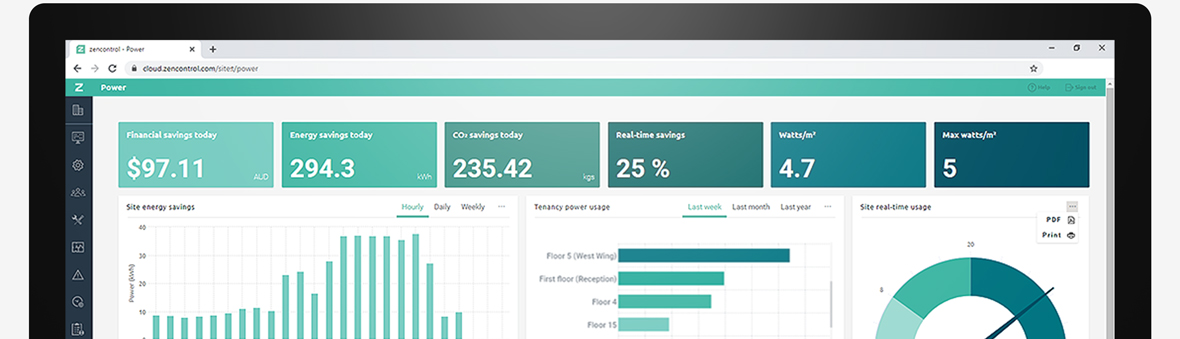
Show and demonstrate power and C02 savings.
Real time metrics show how much your building has saved on power consumption and how much C02 pollution has been saved. Add your energy providers CO2 metrics for accurate tracking.

Find and compare the energy consumption of different rooms, floors and areas.
With the large amount of recorded power data users can compare rooms, areas, or floors to understand how their power is being used. Find the rooms which have the highest power usage and target better control methods to reduce overall consumption.
Power measurements from all devices.
zencontrol power dashboard tracks more than just light fittings, all the components of the system are tracked for power consumption and usage, which includes light switches, sensors, emergency devices, controllers and all wireless products.


15-minute power data – more useful
Taking power measurements over 15 minutes synced to the hours is more beneficial when comparing to your energy bill or showing you consumption shape to an energy retailer. Energy is traded in block of 15 minutes, so it is important to understand how your energy is consumed on the same scale.
Additionally, when the energy retailer gives you a rate, they need to know how your energy consumption fits with their current loading, the more accurate the data the better your rate can be. Knowing where your energy is consumed and when helps you reduce your power bills.
Resources
Learn more and discover more of what the zencontrol Cloud has to offer using the below resources.


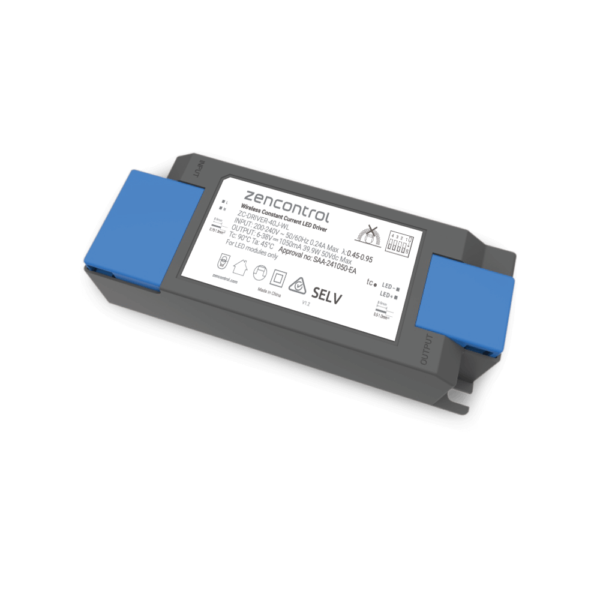
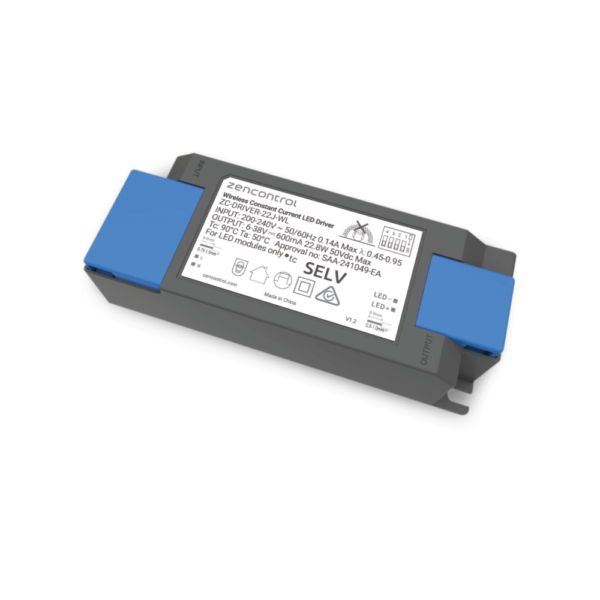
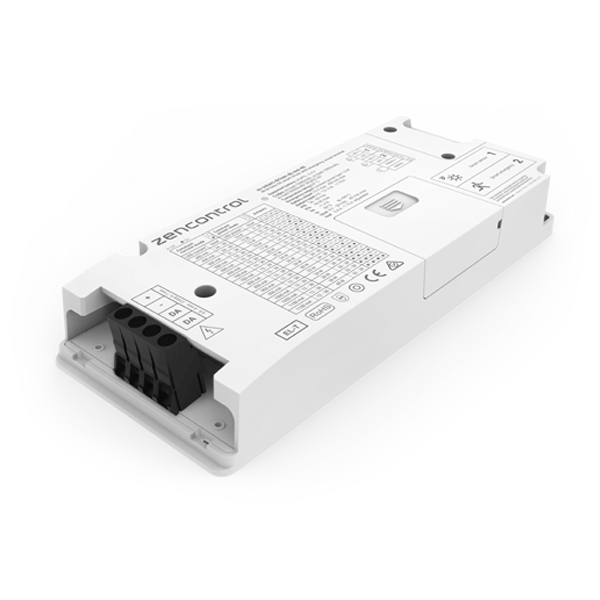
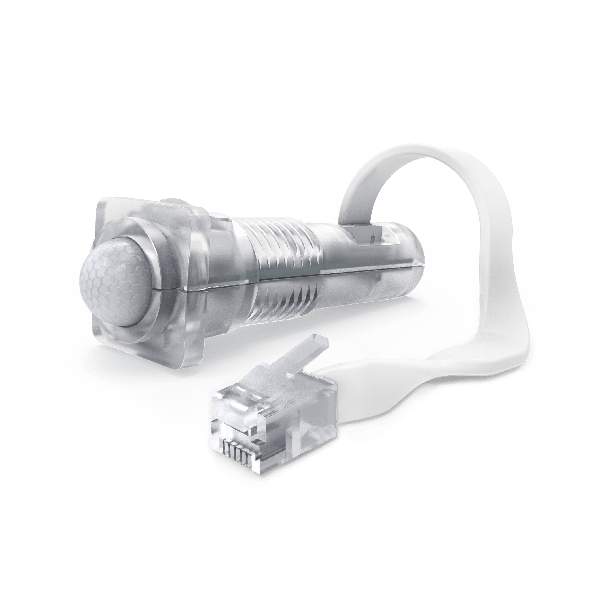
Explore the range
Check out the Smart driver and its wide range of accessories